
WAGTX Commentary (Q1 2021)
March 2021
OVERVIEW
The rotation from growth to value stock outperformance that started in the fall of 2020 continued through the first quarter of 2021. The change in market leadership is newsworthy because growth stocks have utterly dominated returns over the last decade, propelled higher by a set of macroeconomic conditions that have been labelled “Japanification.” Japanification refers to countries (like Japan) with high debt levels and aging demographics. This results in a deflationary trap in which price decreases don’t call forth more demand, leading to slower economic growth and fewer growth companies. Japan hit the debt and demographic wall earliest and hardest, and thus gets the honor of naming rights; however, the majority of global economies, including the two largest, the US and China, have exhibited accelerating Japanification conditions for most of the 21st century.
After nearly two decades investing in Japan, a key outcome of Japanification for equity markets that we have observed is that growth outperforms value significantly. We think there are two simple reason for this:
WE BELIEVE EARNINGS DRIVE STOCK PRICES. When real GDP is close to 0%, growth stocks capture all sales and earnings growth through market share gains, which drives their share prices higher.
SCARCITY VALUE. Growth stocks make up a small fraction of listed companies. Because they are scarce, investors seeking earnings growth crowd into growth stocks and award them premium valuation multiples.
With these in mind, we think there is a good reason for the recent strengthening of value stocks: fundamentals have improved, earnings are being revised up, and earnings drive stock prices. Value stocks are typically businesses reliant on JFK’s proverbial economic rising tide that lifts all boats (think banks, oil producers, and construction companies). When GDP growth is strong, value stock revenue and earnings growth are strong; when GDP growth is weak, their earnings stagnate. Growth stocks are less tethered to the economy. If we riff on JFK’s metaphor, secular growth companies are like drones hovering over the port, independent from the boats undulating with the tides below. During periods of rapid GDP acceleration or deceleration, value stocks tend to be more volatile as earnings expectations are revised dramatically up or down.
The COVID pandemic lockdowns caused a historically sudden drop in GDP. Earnings estimates for value stocks were cut back hard, while growth stocks faced relatively minor earnings revisions. Remember there was a moment last spring when the price of a barrel of oil somehow managed to hit NEGATIVE $37 — that input is bound to wreak havoc on analyst estimates for oil producers! Shares of growth stocks significantly outperformed value stocks through the first nine months of 2020. In the S&P 500, perhaps the most important global equities index, growth stocks increased 20% during the period, compared to the 11% decline seen in value stocks. We saw this same pattern in the key international indexes where our investments are listed.
With time, people adapted to the COVID economy and found new ways to safely do business. Several drug companies developed effective COVID vaccines on heroically short timelines. And GDP growth rebounded sharply. Earnings projections for value stocks had to be revised up quickly, and their share prices rallied to catch up with those expectations. During the December 2020 and March 2021 quarters, S&P 500 value stocks rose 27%, beating the 13% increase in growth stocks.
The value rotation has been a temporary headwind for the World Innovators Fund, causing underperformance compared to our benchmark during the March quarter. Nevertheless, our strategy of investing in small, fast-growing, disruptive companies has generated superior results for the Fund over the long run.
| Periods ended 3/31/21 | WAGTX | MSCI ACWI Ex-USA Small-Cap Index* |
|---|---|---|
| Quarter | -2.56% | 5.53% | Year | 115.82% | 69.82% | 3 Years Annualized | 20.14% | 6.69% | 5 Years Annualized | 19.90% | 10.40% | 10 Years Annualized | 14.29% | 6.32% |
Data shows past performance. Past performance is not indicative of future performance and current performance may be lower or higher than the data quoted. For the most recent month-end performance data, visit www.sevencanyonsadvisors.com. Investment returns and principal value will fluctuate, and shares, when redeemed, may be worth more or less than their original cost. The Advisor may absorb certain Fund expenses, leading to higher total shareholder returns. The Advisor has contractually agreed to reimburse Total Annual Fund Operating Expenses in excess of 1.76% and 1.56% for the Investor Class Shares and the Institutional Class Shares respectively until at least January 31, 2022. This agreement is in effect through January 31, 2022, may only be terminated before then by the Board of Trustees, and is reevaluated on an annual basis.
DETAILS FROM THE QUARTER
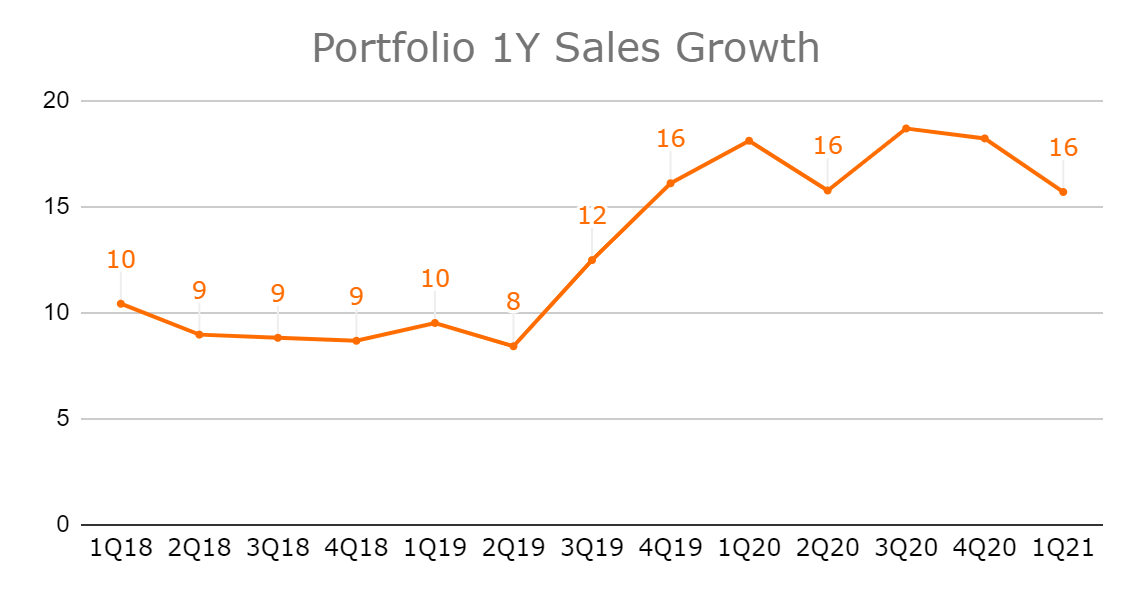
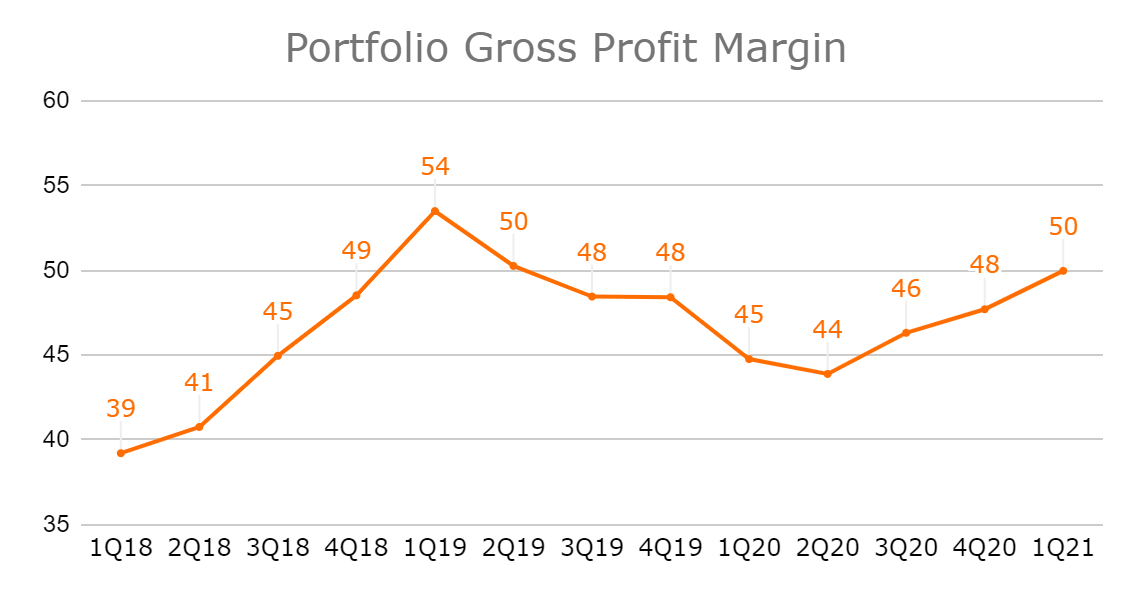
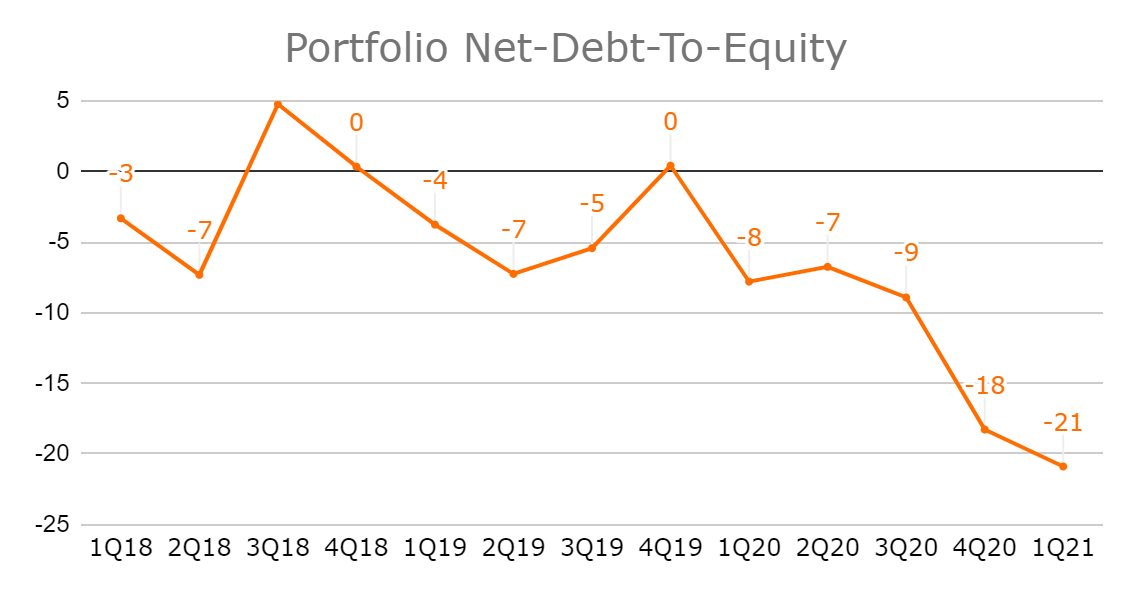
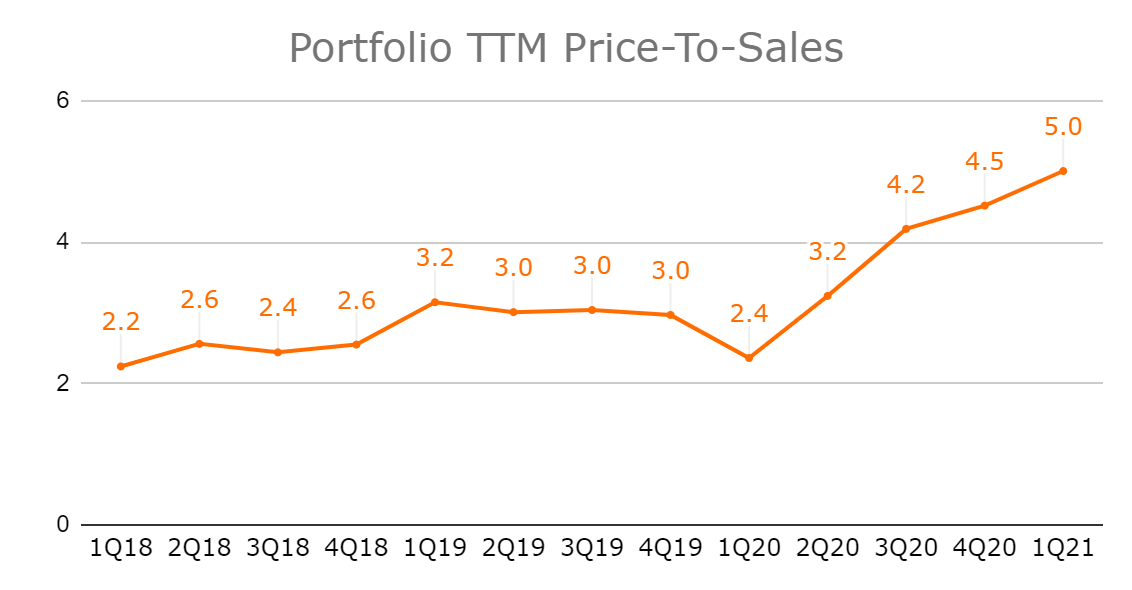
The key metrics for World Innovator companies are double-digit sales growth, high and improving gross profit margins, and strong balance sheets — often with more cash than debt. We track these key metrics quarterly on a portfolio level to ensure our actual investments deliver on our stated investment strategy. In addition, we track the price-to-sales ratio on a portfolio level to give us an idea how much of a premium we pay for what we consider to be a premium portfolio.
Source: Bloomberg
The key metrics for the portfolio have improved significantly over the last three years. This reflects our increasing conviction that the effects of Japanification may cause growth stocks to outperform. True, the price-to-sales ratio has steadily risen over the same period; we are paying 5.01x sales for our current portfolio, more than double the 2.24x we paid for Q1:18’s portfolio. We think we are getting our money’s worth. The companies we own today are growing sales twice as fast, their GPMs are more than 10 percentage points higher, and they have better balance sheets.
Our growth focus translates into sector, country, and individual stock weightings that are dramatically different from our benchmark. For example we are consistently overweight the sectors where secular growth companies are most common (Technology, Health Care, and Consumer Discretionary), and underweight the value/commodities sectors (Financials, Energy, and Materials.) This makes beating the benchmark difficult during periods like the last two quarters when value stocks outperform. For the March quarter, 23.77% of the benchmark was in Financials, Energy, and Materials, which were up 10.58%, 10.11%, and 5.65%, respectively. In comparison, only 2.65% of WAGTX was invested in those sectors, so we missed most of the value/commodity sector rally.
During the quarter the three main themes for trades executed were:
Selling stocks where valuations had become extreme. For example, Freee KK (4478 JP) and Rakus (3923 JP), cloud-based software developers in Japan; and Temple & Webster (TPW AU), an online furniture retailer, aka “the Wayfair of Australia”.
Adding to names with great growth and reasonable valuations where profit-taking and the value rotation offered up discounts. For example, meal kit providers Marley Spoon (MMM AU) and Oisix Ra Daichi (3182 JP); and cloud-based text communications platform Whispir (WSP AU).
Adding to names where growth will accelerate due to vaccine distribution and economies opening up. For example, the maker of premium spirit mixers Fevertree (FEVR LN), Mexican discount airline Volaris (VLRS), and cold logistic provider for vaccine distribution va-Q-tec (VQT GR).
The individual stock with the largest positive contribution was Basler AG (BSL GR). Basler makes automation equipment used in manufacturing. Toward the end of 2020, the order book grew nicely as manufacturers gained the confidence to order new equipment again, and the stock reacted with a 30.91% jump. The largest detractor from performance was AO World (AO/ LN) the leading online appliance retailer in the UK. This was largely due to profit-taking after the stock’s big year in 2020.
OUTLOOK
The Fund’s alignment with secular growth segments of the market means that we have been operating under tailwind conditions for most of the last decade. It also means that a sustained market reversal where commodities, commodity producing countries, and value stocks regain the lead means headwinds for the Fund. However, we think that the COVID-pandemic has accelerated not mitigated Japanification conditions. Government stimulus packages have pushed debt levels even higher and aging demographic trends are unchanged. For this reason, we still think growth stocks are the better place for investors focused on the medium and long term.
Furthermore, after two quarters of market leadership, we think value stocks have priced in a very strong economic rebound and associated improvement in earnings expectations. Some value stocks seem closer to their fair non-pandemic values now, and many may have even surpassed fair values. We believe that as the low base effect caused by the first COVID lockdowns dissipates this summer, value/commodity stocks (the boats) will have a tough time putting up sustainable double-digit sales and earnings growth rates. On the other hand, market share gaining growth stocks (the drones) can keep up their relentless double-digit growth pace. If we’re correct that earnings drive stock prices, then growth stocks will likely retake leadership.
Finally, we acknowledge that individual growth stocks can be prone to extreme hype and valuations. These tend to be bigger companies that frequently land front page headlines, i.e. Tesla, Shopify, ZOOM, and Beyond Meat. This happens to small cap stocks as well, as seen in the examples mentioned above of small companies we owned and sold due to extreme valuations. We believe we can recognize when the hype overtakes the reality, and can continue to find great off-the-radar growth companies trading at favorable valuations.
We are grateful for our shareholders who share our vision and are willing to invest alongside us.
Definitions
Net Debt-To-Equity: The ratio used to evaluate a company's financial leverage calculated by dividing a company’s total liabilities by its shareholder equity.
TTM Price-To-Sales: The ratio shows how much investors are willing to pay per dollar of sales for the trailing twelve months (TTM).
For a list of current top ten holdings and performance charts, please click here.